
Sewer network cadastre
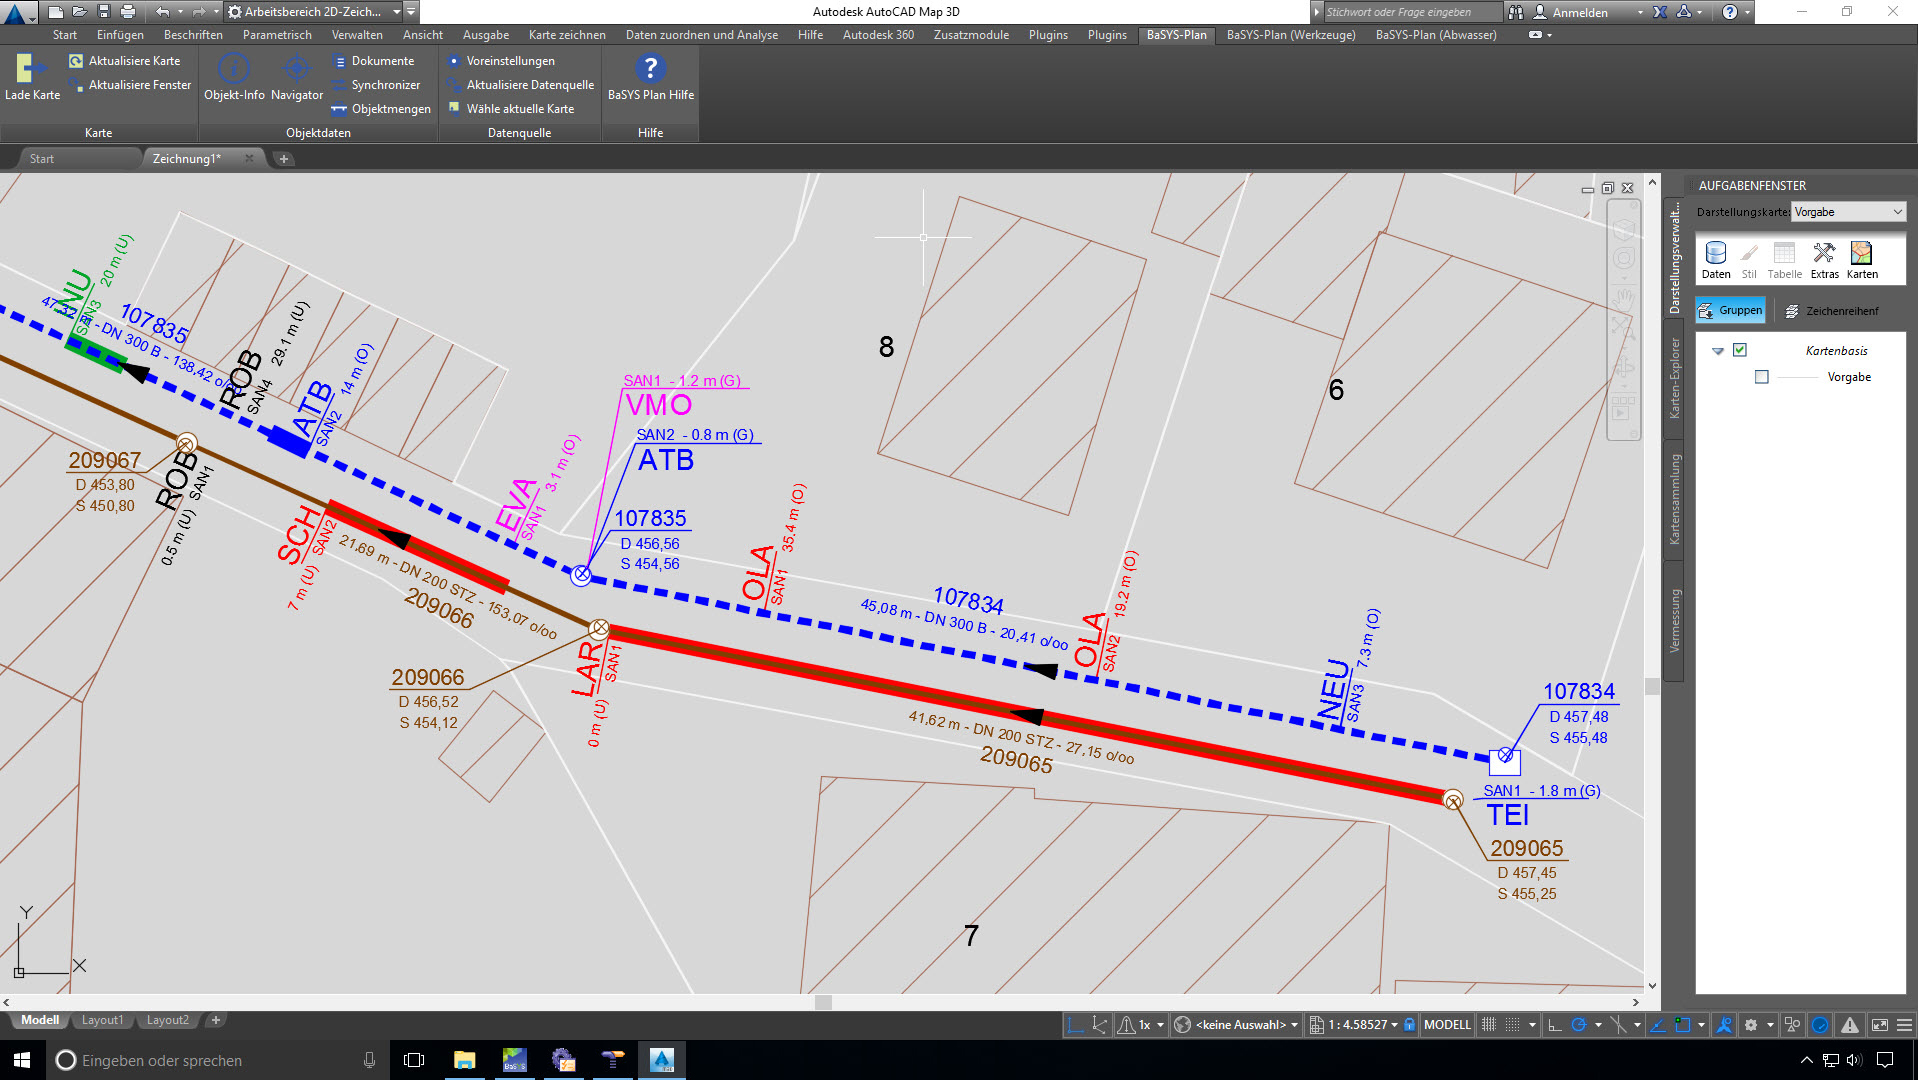
The graphical, interactive BaSYS sewer network cadastre is used for the database-driven recording and documenting of sewer networks on the basis of the supported CAD (AutoCAD, BricsCAD, Microstation) and GIS applications (ArcGIS, Geomedia, QGis).
Convenient analysis and evaluation tools are also available in administration. Recorded sewer segments, manholes, service connection pipes, catchment areas and special structures are automatically stored in a project database, including all technical information. Thus the distribution network can be graphically generated again and/or updated from the database at any time. All forms of representation for the sewer network are supported as well.
OpenGIS-compliant geometries can be recorded and administered for all sewer objects. Modelling the topology of the sewer network cadastre makes it possible to work without fictitious manholes. This means pipe bends for example can be assigned directly to the pipe run or a separate sewer system to only one manhole (twin manhole). Manhole or structure boundary points can be recorded as polygons and weir sills as polylines, with object-specific administration.
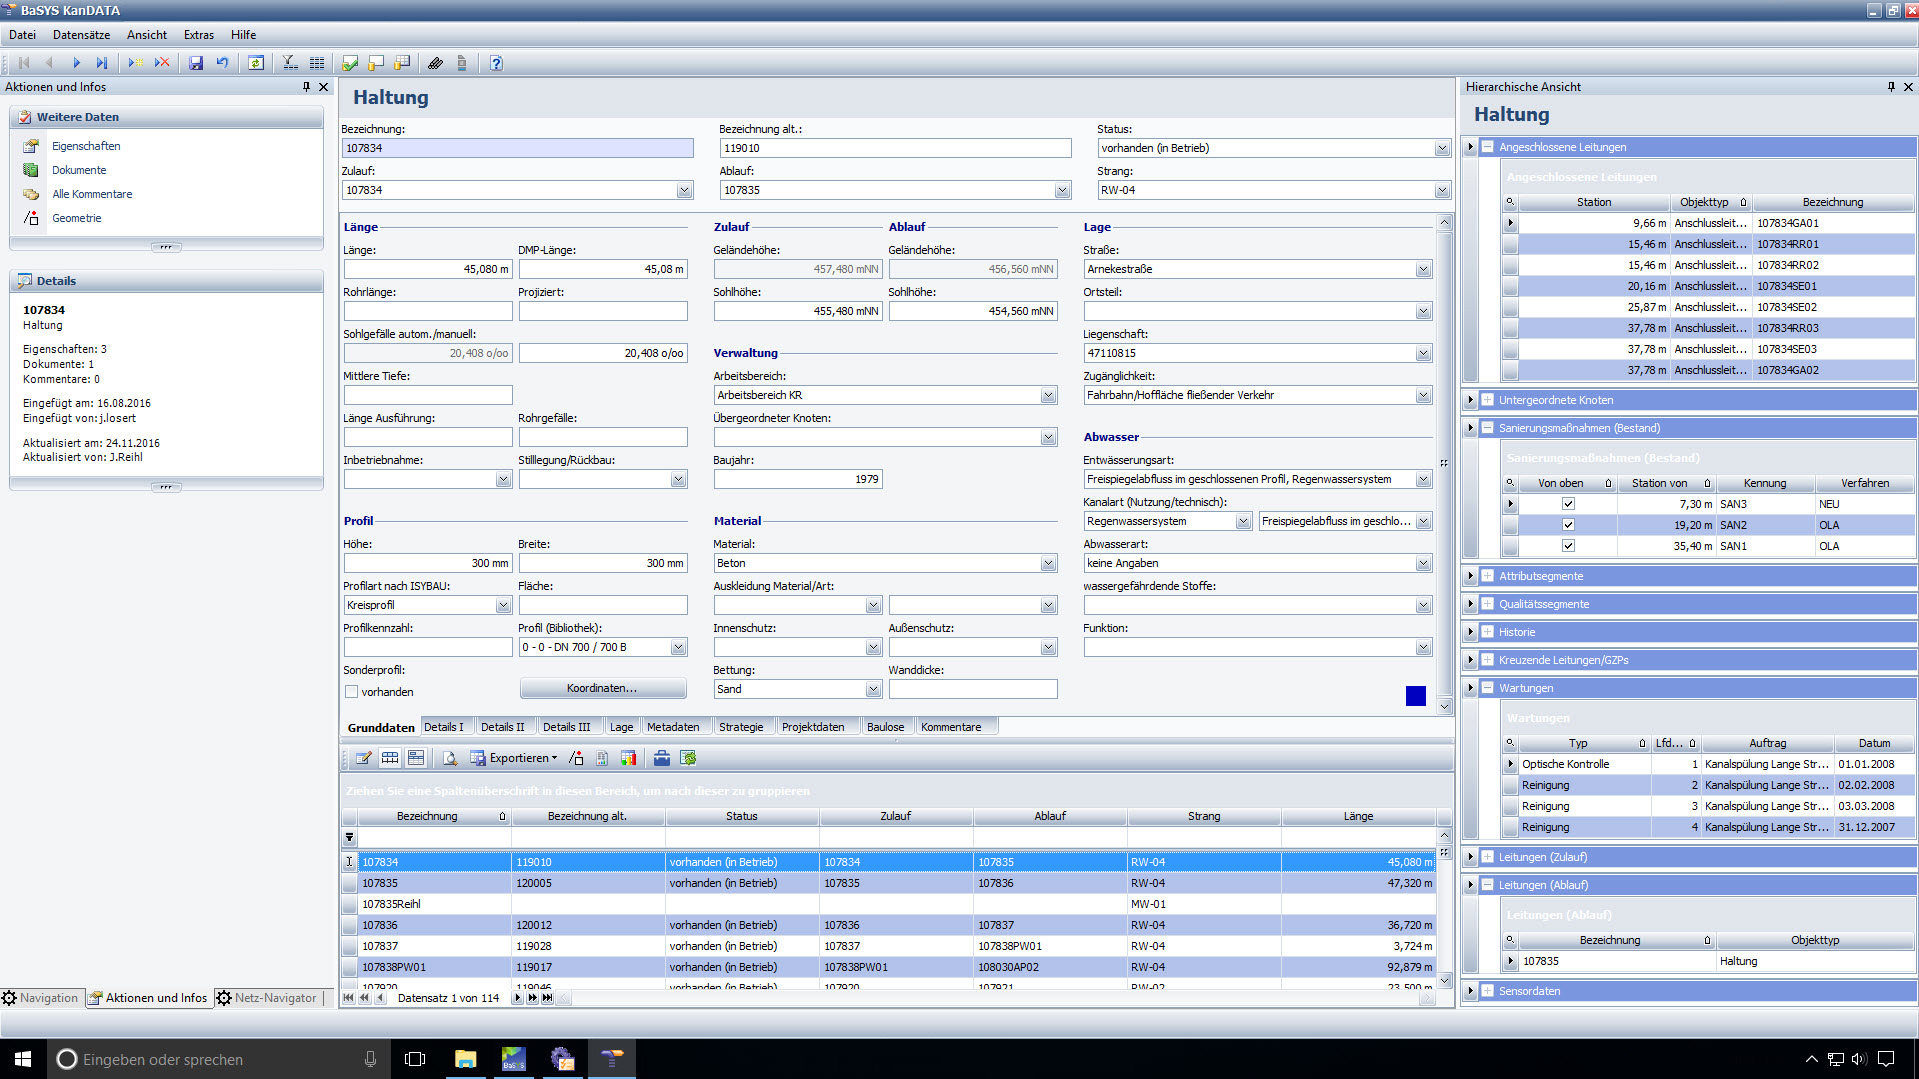
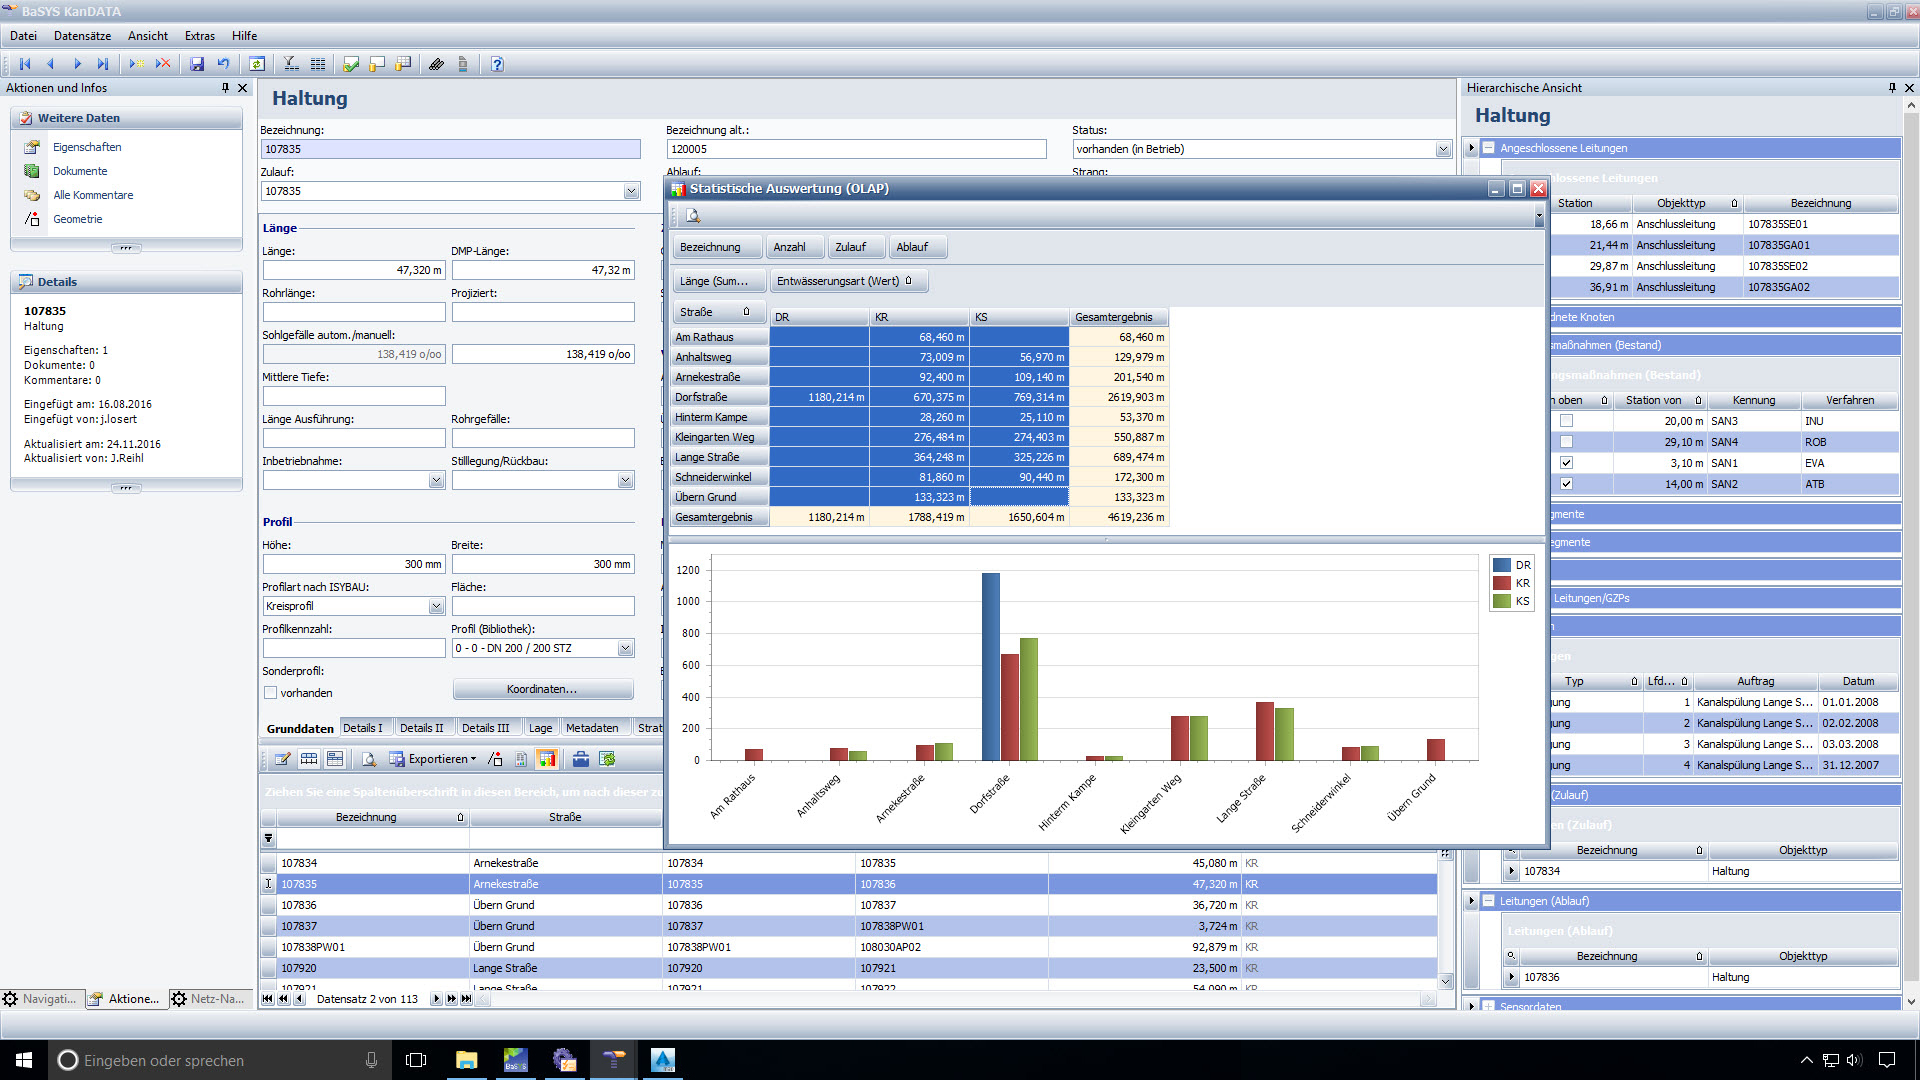
Detailed and list views in the available technical data forms are provided for the administration and editing of sewer source data, including the rehabilitation portfolio and sewer network maintenance data. Plausibility routines are available here as well. These show for example the pipes where the pipe bed heights are below the manhole bed heights or the slope is less than the permissible minimum.
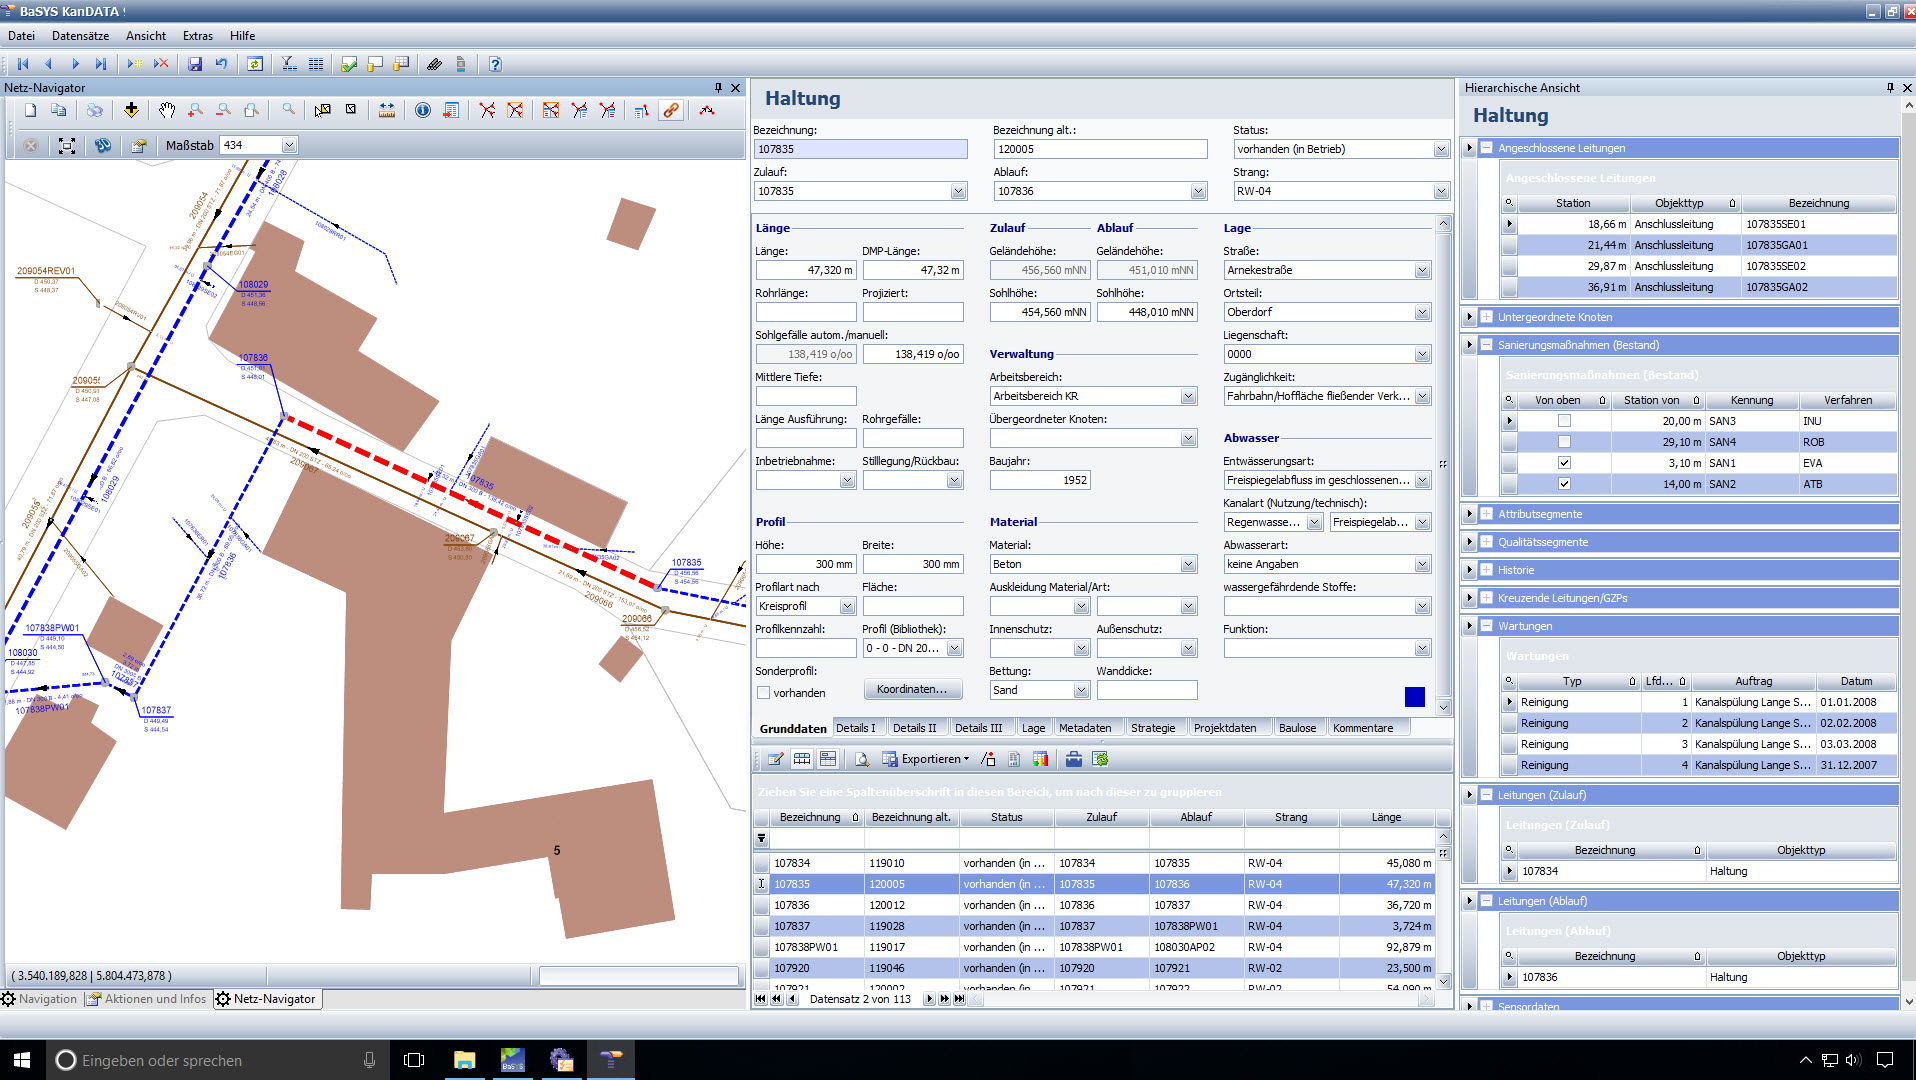
A Network Navigator integrated directly into the data management interface supports rapid and straightforward graphical visualisation and bidirectional communication with the object data of the network elements, even without additional CAD/GIS licenses. Visual verification of the network elements is tremendously simplified with the optional integration of background maps.
Standard interfaces such as ISYBAU 0196 / 0601 or ISYBAU 2015 XML support the convenient exchange of sewer source data in a system-independent format. Survey data of existing sewer objects can also be transferred into the source data via a freely configurable ASCII interface .
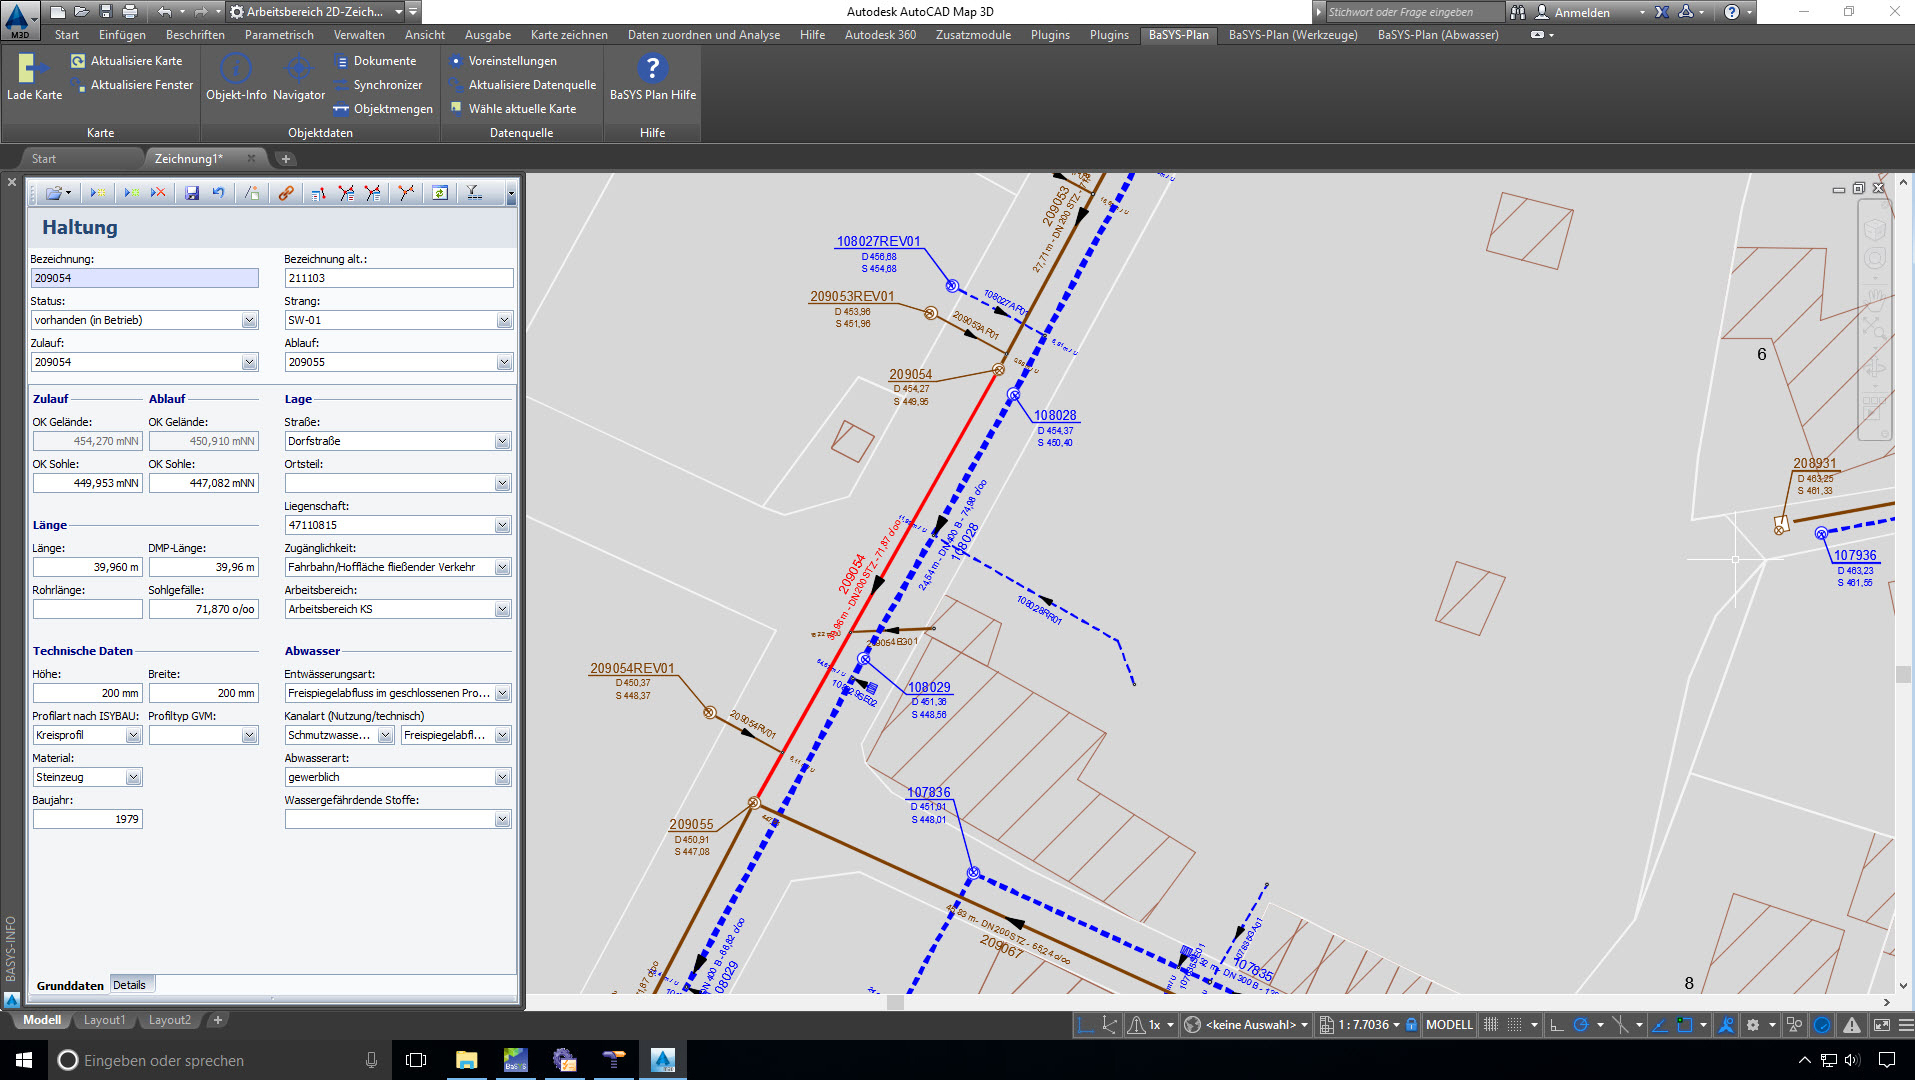
The planner is provided with an extensive graphical interface for data collection. Specific processes for recording and editing point, line and area elements are combined into cohesive workflows.
Thus the geometries of the vector data, for example from existing DXF cadastral drawings, can be assigned directly to the sewer objects in the supported CAD programs and transferred. Existing cadastral maps can therefore be integrated into the system very quickly. A convenient tool is provided for the digitalisation of cadastral maps on the basis of grid data. It can be used for example to automatically assign manholes and sewer segments to the corresponding location and profile data at the time of data collection.
Once sewer objects have been recorded, they can of course be subsequently edited using a graphical interface. When moving a manhole for example, all values of the connected pipes that are dependent on the new position, such as pipe lengths and slopes, are automatically calculated and updated.
Furthermore, a covered manhole found in the course of a visual inspection for example can be subsequently assigned to a sewer segment, positioned and segmented accordingly. Naturally the linear interpolation of the corresponding elevation data for the newly created sewer segment is automated.
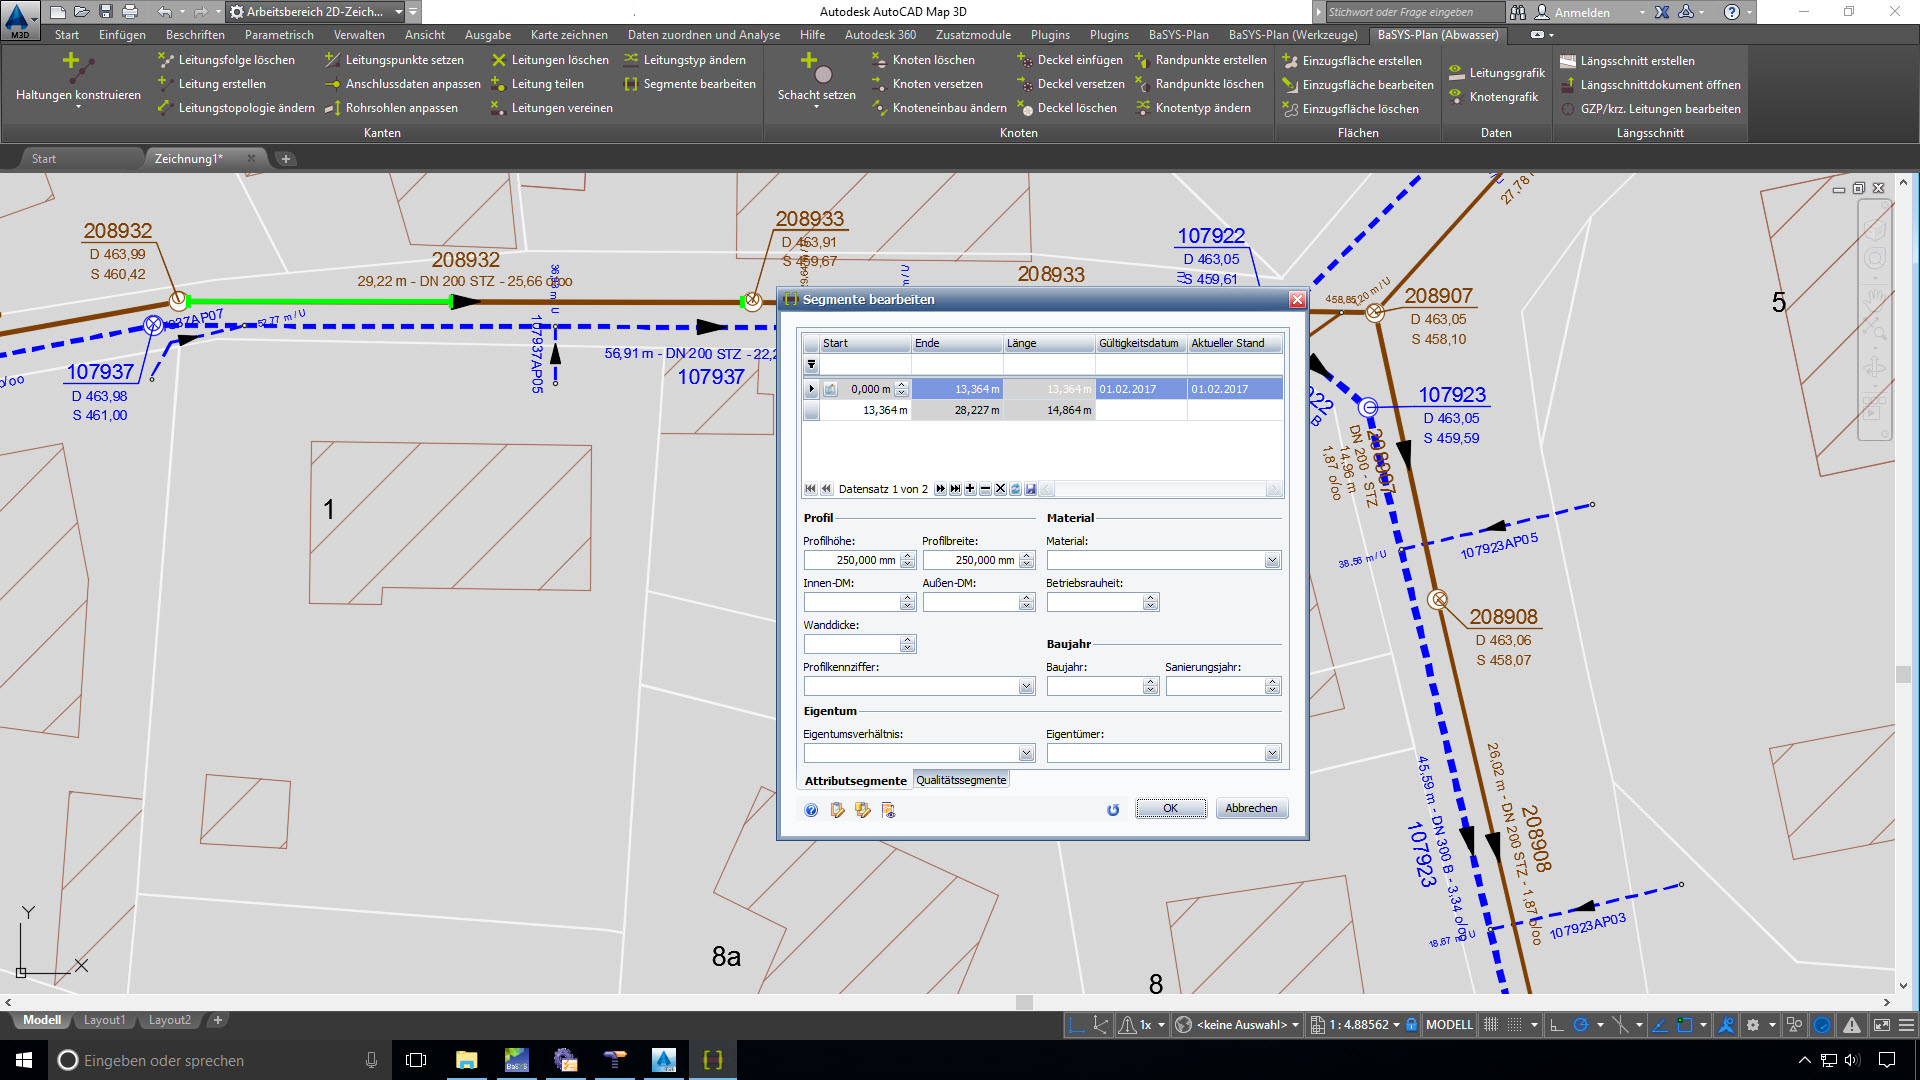
A sewer segment can be divided into different segments, for example to document a change in the material or nominal width within a pipe run. An interactive longitudinal section is provided for the fast verification of elevation data. All elevation data can be edited manually or automatically here in case of errors.
A detailed technical data form for each object is available for the documentation of rehabilitated sewer segments, service pipes, troughs, channels, manholes and structures. The included data fields are based on the requirements of the sewage directives and can be populated manually or via the ISYBAU 01/96 or 06/01 standard interfaces type KS and also the ISYBAU 2006 XML interface.In a schematic rehabilitation graphic, completed rehabilitation work that has been entered can be graphically visualised with all required information and printed if needed.
Service pipes are treated as a special pipe type. All functions available for sewer segments naturally apply for this pipe type as well. Service pipes can be generated automatically from completed visual inspections of sewer segments, service pipes and manholes. Options can be configured, for example to convert the recorded stationing information against the flow direction according to DIN 2425 or in the flow direction during generation.
A schematic fittings/branch fittings graphic can be prepared from the connection data. It shows all connections for a reference pipe with different symbols for all active or inactive fittings or branch fittings.
To complete statistical evaluations quickly and easily, data analysis is possible directly from the list view in the technical data forms without having to use a spreadsheet program. Database fields can be compiled at will with full flexibility in a pivot view using drag & drop.
Statistical functions such as count, sum, average or standard deviation can be assigned to the respective selected database fields. For example, the length information for the various kinds of drainage depending on the assigned streets can be determined at the push of a button.
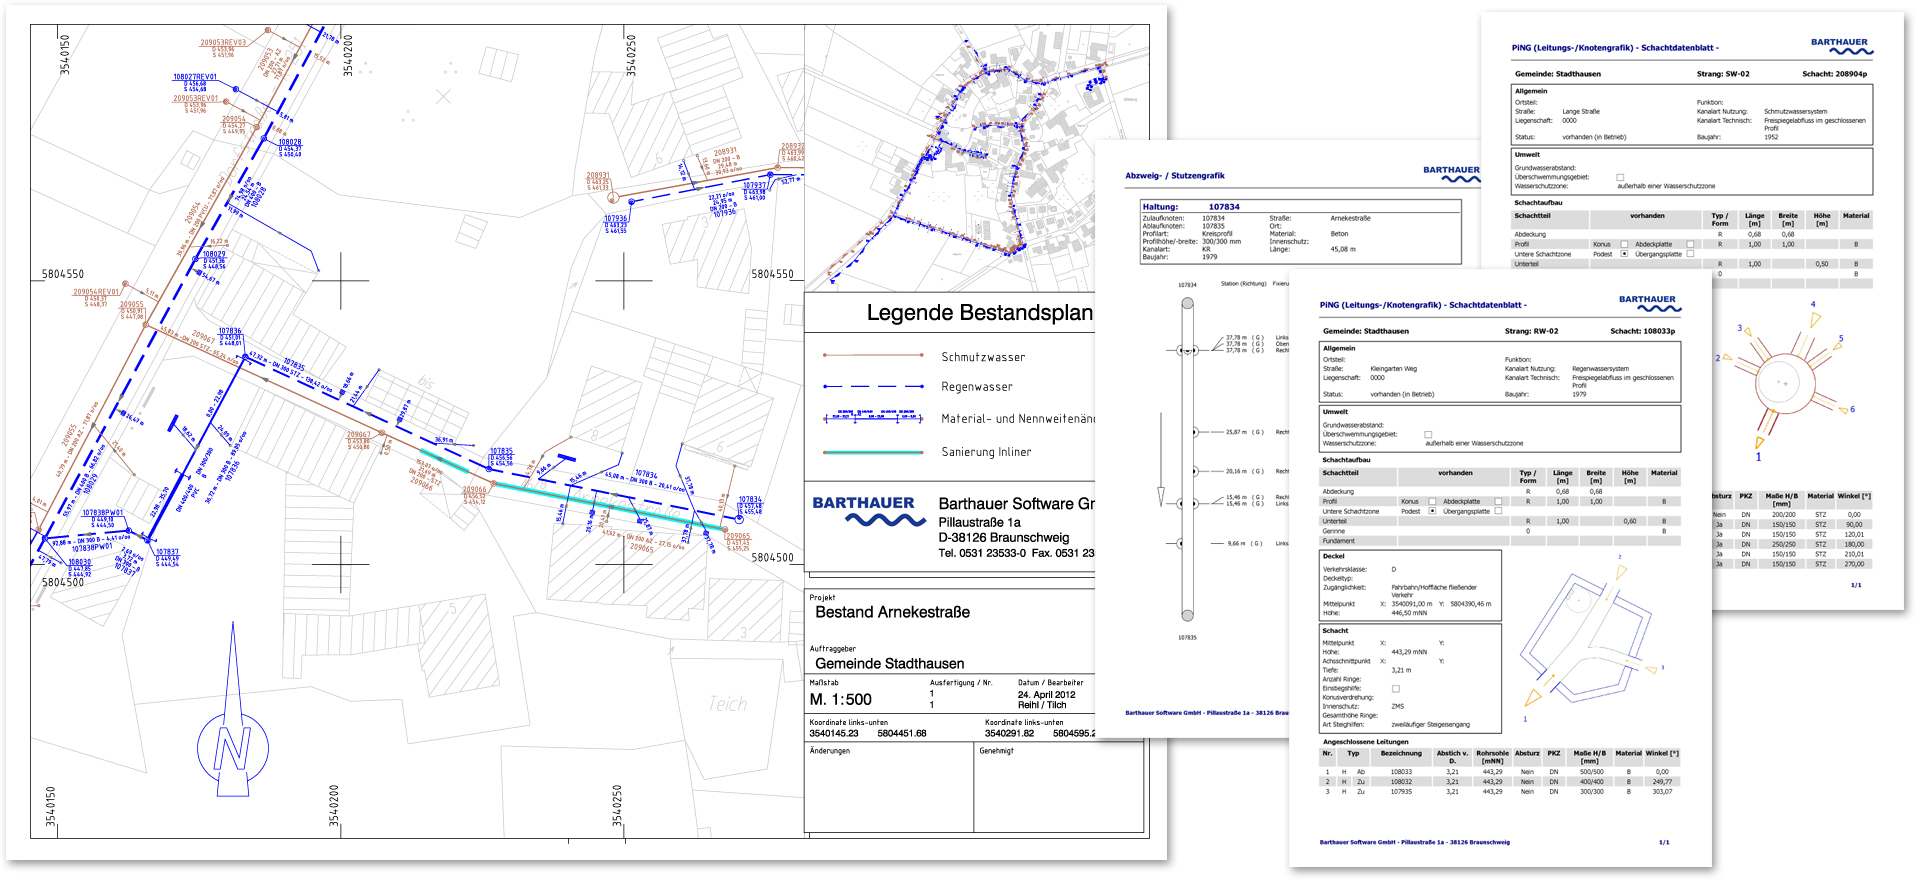
The data of the recorded and administered sewer network cadastre can be viewed and output in a variety of forms in the BaSYS sewer network cadastre. Numerous standardised reports are available. Custom reports can be defined using the integrated Report Designer. The data can also be exported to Excel for further processing.
The node graphic presents the layouts of manholes and structures with all incoming and outgoing pipes (sewer segments and service pipes). This is based on the geometry data such as manhole covers or manhole centres, pipe connection points, coordinate reference points and structure boundary points. Dimension lines with angles in GRAD, GON or RADIANT are assigned among the corresponding pipes through an option setting.
Theme plans with different layouts and scales are available for the output of inventory site plans. Aside from an inventory plan based on the building guidelines for surveys, a fitting and branch fitting plan designed according to DIN 2425 is available as well. The rehabilitation portfolio can be displayed in both plans.
Naturally our Consulting team can adapt layouts and inventory plans to meet individual requirements. Find out more...